plotkit
A pure-Rust plotting library — publication-quality plots in three lines of Rust, with no GPU or system dependencies.
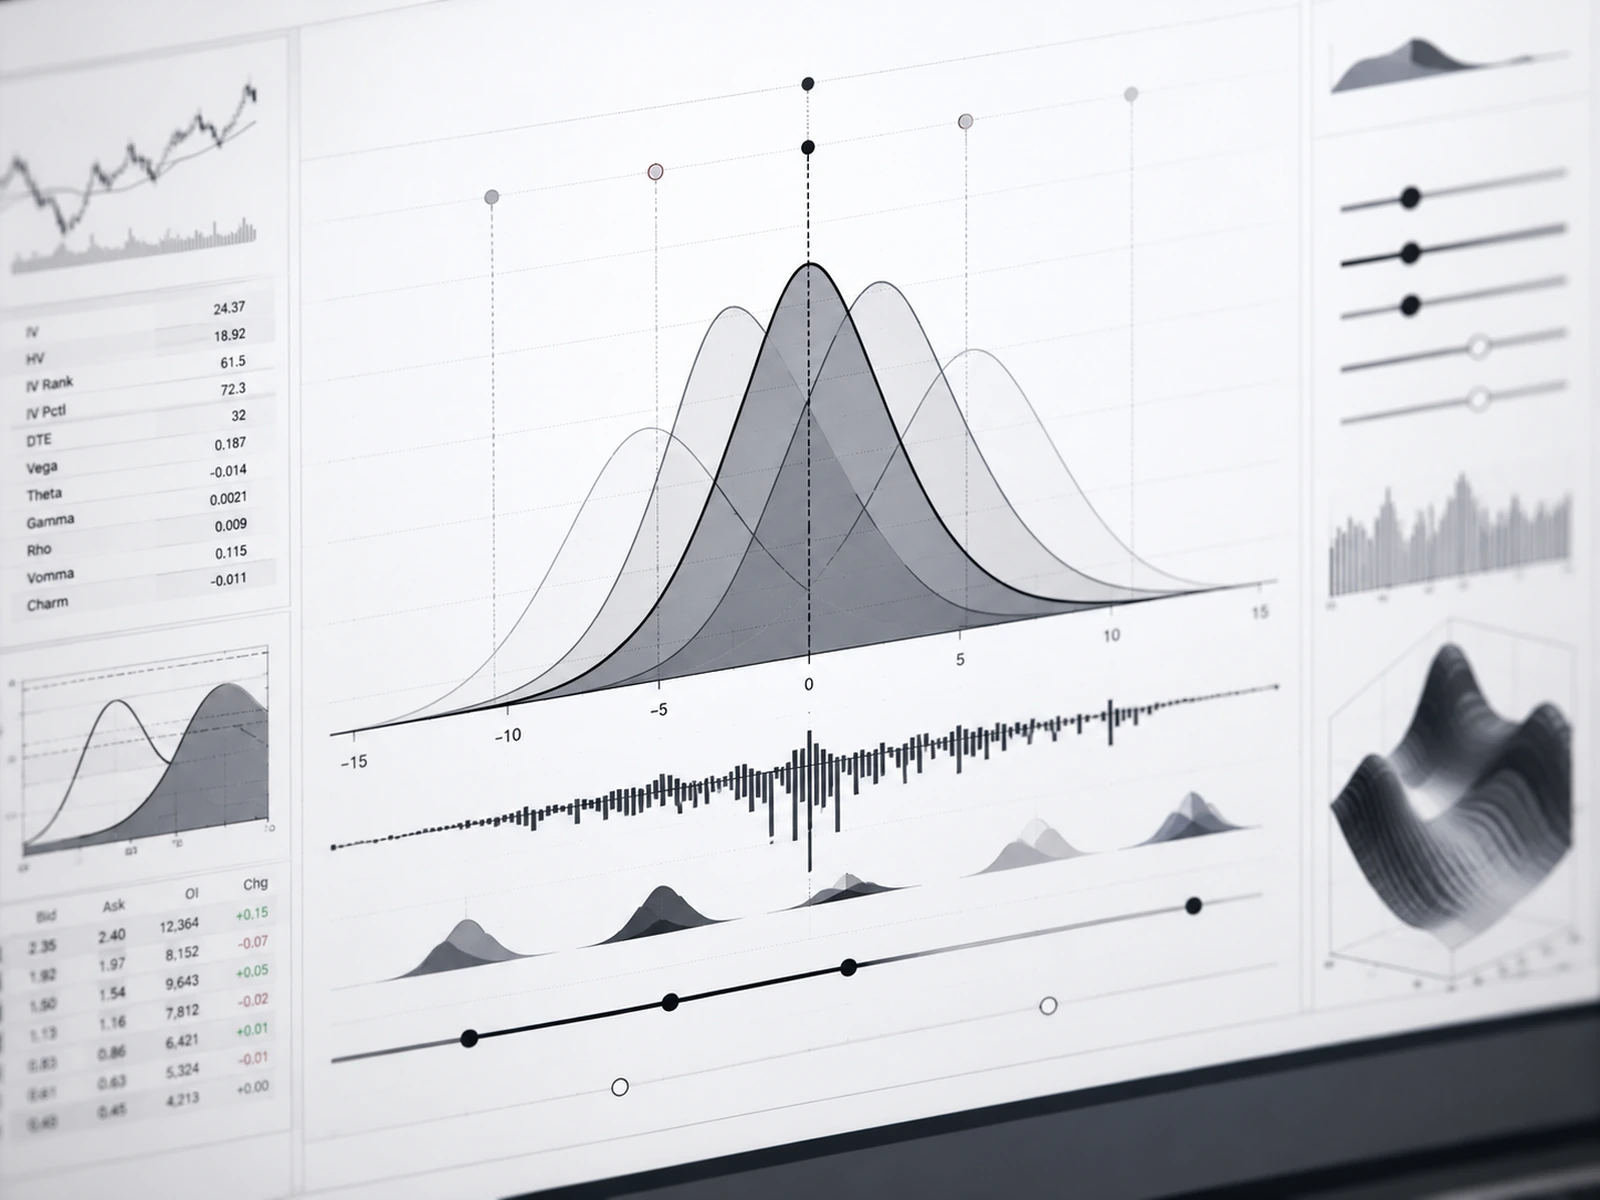
Publication-Quality Plots in Pure Rust
Charting in Rust has meant either inheriting a system plotting stack's native dependencies or learning an API nothing like the matplotlib most data people already know. plotkit (repository name plotrs) removes that trade-off: publication-quality plots in three lines of pure Rust, through a matplotlib-familiar pyplot facade over a Figure/Axes model, with 16 chart types, PNG/SVG/PDF output, and an embedded font for deterministic rendering — no GPU or system dependencies. Dual-licensed MIT/Apache-2.0.
Challenge
Rust developers who want charts usually face a trade-off: bind to a system plotting stack and inherit its native dependencies, or learn an unfamiliar API far removed from the matplotlib idioms most data practitioners already know. Deterministic output across machines — the same bytes from the same code — is rarely a given when rendering depends on system fonts and libraries.
Approach
Build the entire pipeline in pure Rust. plotkit exposes a matplotlib-familiar surface — a pyplot facade for quick plots and a Figure/Axes model for structured composition — rendering to PNG, SVG, and PDF. It ships 7 themes and 14 perceptual colormaps, integrates first-class with Polars DataFrames and ndarray arrays, runs in the browser through a WASM/canvas backend, and embeds its own font so rendering is deterministic regardless of the host system.
Outcome
An open-source plotting library that Rust projects can adopt without GPU or system dependencies: 16 chart types behind an API that feels familiar to matplotlib users, deterministic output for reproducible figures, and the same code path targeting native binaries or the browser via WASM. Dual-licensed MIT/Apache-2.0.
Key Features
- 16 chart types
- PNG, SVG, and PDF output
- matplotlib-familiar API — pyplot facade plus Figure/Axes model
- 7 themes and 14 perceptual colormaps
- First-class Polars and ndarray integration
- WASM/canvas backend for the browser
- Embedded font for deterministic rendering
- No GPU or system dependencies
Stack & Methods
- Pure Rust — no GPU or system dependencies
- pyplot facade + Figure/Axes object model
- PNG/SVG/PDF renderers
- Polars and ndarray data integration
- WASM/canvas backend
- Embedded font for deterministic rendering
- Dual MIT/Apache-2.0 license
Need charts, dashboards, or data tooling built?
Tell me what you're building — I reply within 24 hours, and the first consultation is free.